
Like the foundations of a house which inherently must be the strongest structure of the building to ensure a stable construction – so too, is an efficient cardiovascular system in the sense of building a strong, powerful and fast cyclist. Through developing a robust cardiovascular system, the ability to absorb intense training loads magically opens. So, in this article, I will outline the importance of building a strong endurance aerobic base fitness, and the importance of assessing aerobic fitness through monitoring cardiovascular drift.
Now, before we dive deep into the concept of cardiovascular drift, lets briefly explore how heart rate and power data are used to establish cycling fitness benchmarks, and to routinely monitor cycling fitness progress.
Physiologically, cycling is classified as an endurance exercise, in the sense that the body undergoes repeated and continuous isotonic muscle contractions, where over time, cyclists build large amounts of metabolic properties such as mitochondria and various other oxidative enzymes that assist in delivery of oxygen to the working leg muscles [1].
But, without complex laboratory equipment, how can cycling fitness be monitored form the comfort of your own home?
The answer is simple, and that is to routinely monitor cardiovascular fitness such as heart rate, in relation to a given power output [2]. This other words, monitor how your cardiovascular system responds to the demands of cycling in relation to power output [3].
So simply speaking, cardiovascular stress (such as heart rate) is the result of the mechanical stress placed into propelling the bike forwards [2]. Whereas, power output is an immediate and direct metric that is used to ‘explain’ to and provide ‘insight’ into cardiovascular stress, and why the heart responds the way it does [2].

What is Cardiac Drift in Cycling?
Before we get into this section please know we’re about to get quite technical on human biology. Reason being, it’s important we go deep into the functions of the heart muscle upfront, in order to set the stage, before demonstrating a real world example. With that said…
Typically, during submaximal steady riding or commonly known as ‘endurance pace’, your zone 1 and 2 power should represent moderate exertion levels, with a heart rate reading between approximately 65%-75% maximum heart rate, and of course some fluctuations in hear rate for those riding outdoors.
Well, let’s now take a look at cardiovascular drift and how the heart works in response to cycling…
The phenomena of cardiac drift involves one main cardiovascular response commonly known as cardiac output, which entails two factors – stroke volume, and heart rate [3]. In which, the product of stroke volume and heart rate, equals cardiac output [3].
Quite simply, cardiac output is the amount of oxygenated blood that is pumped and circulated around the body that is commonly measured in litres per minute, and heart rate is the number of times the heart beats per minute [3].
With the above in mind, changing any one of the two factors will influence the manner cardiac output is achieved, as the body attempts to maintain a steady cardiac output, regardless of the intensity.
Lets take a look at an example of two hypothetical cyclists of similar ability:
‘Cyclist A’ has a heart rate of 150 beats per minute, with a stroke volume of 70ml, thus a cardiac output of 10,500mL per minute. Whereas, ‘Cyclist B’ has a heart rate of 170 beats per minute, but, a stroke volume of 61.77ml, thus the exact same cardiac output as his counterpart. Ultimately meaning, ‘Cyclist A’ has a larger stroke volume compared to ‘Cyclist B’, allowing his heart to beat at a slower rate and conserve energy, whilst ‘Cyclist B’ must work harder under the same power output to achieve the same cardiac output.
But here’s the thing about a cardiac drift…
Cardiac output generally does not change when either stroke volume or heart rate change as we discovered above [4]. In fact, during a cardiac drift, stroke volume decreases, whilst heart rate increases under a set load, thus not altering cardiac output [4]. Meaning, the heart as a muscle must work harder to maintain cardiac output, at a given power output.
So, what does this all mean?
The answer is that a strong and powerful cardiac muscle, yields greater stroke volumes per muscle contraction of the heart, and fewer beats [3]. In other words, when a cardiac drift occurs, the sympathetic nervous system triggers a rise in heart rate, to compensate the decrease in stroke volume, which results in a loss of efficient cardiac functioning [3].
Yes, there are many factors that can influence heart rate such as heat, caffeine, and other variables. However, in such circumstances, cardiac output is likely to alter, and other fatigue mechanisms are likely to kick in besides a rise in heart rate [4].
Yet, it is important to note that cyclists with a smaller ‘heart’ muscle, tend to possess a greater heart beat compared to those with a larger ‘heart’ muscle. With that said, this simply means that cyclists with a small cardiac muscle have an increased heart beat and often a greater maximum heart rate than those with a larger muscle.
However, with elimination of ‘noise’ such as excess heat or caffeine consumption, strong research supported by the World Health Organization (WHO), recommend moderate intensity endurance type exercise for more than 60 minutes to stress the cardiovascular system [4], thus improving aerobic fitness by controlling the stroke volume [4].
While it may be very much cliché that moderate intensity cycling improves cardiovascular fitness, in fact, scientific studies have indicated that stressing the stroke volume is highly proven to improve cardiac function [5]. Where the decrease in average heart rate at a moderate or zone 2 intensity, is due to the greater stroke volume or blood ejection and contractility of the cardiac muscle [5] .
Now, to put this all into once sentence, it would be safe to say that “cycling at a steady and moderate / or zone 2 intensity, in a manner that stresses stroke volume builds a more efficient cyclist”.
Let’s get this straight…
An increase in stroke volume is an invisible response to the naked eye, whilst heart rate data is not. So yes, it may seem useless performing endurance type cycling such, yet, research strongly presents that increasing stroke volume through endurance type training, is far more effective than increasing the heart rate to respond to the demands [5].And, quite simply, a lowered heart rate and increased stroke volume means less exertion for a given power output, or even better, an increase in power output [5]!

How to Assess Heart Rate Fitness using Cardiac Drift
So, we’ve explored what cardiac drift is, and what it truly means to improve cardiovascular fitness on the bike. But, in case you’re wondering how to test cardiac drift and monitor fitness adaptations, hang on because I’m about to explain it.
Essentially speaking, as you discovered earlier that cycling is classified as an endurance sport that requires a large amount of cardiovascular input, it only makes sense to monitor cardiac fitness adaptations. But how is this done?
Now, to monitor cardiovascular drift, you’ll need two items, and that is a heart rate monitor and a power meter.
Using the heart rate monitor, set out for an easy 1 hour ride within zone 2 as calculated by your power meter, and at 65-75% of your maximum heart rate value, opting for a comfortable cadence.
And… of course, even pressure on the pedals to produce a steady power meter reading.
Assuming a steady cadence and even pressure on the pedals was adopted, taking a look at your heart rate values, draw either a real or imaginary trend line along the heart rate values, while taking note of your average heart rate. Then, record the values, and set them aside as your baseline cardiac fitness.
Fast-forwarding 4-6 weeks, head out for another easy ride, and replicate same ride you initially using the same route, power, duration and climate, and record your heart rate response.
Now, using both your baseline values, and your post 4-6 training block, compare the difference in cardiac drift, as well as average heart rate.
Will you experience a lesser cardiac drift, or possibly a reduced heart rate? Likely! Because the science is pretty clear that endurance type training increases stroke volume, and lowers the average working heart rate. Meaning, endurance type training allows for the heart to eject significantly larger amounts of blood to the working muscles.
While at the RCA, we refer to an improvement in fitness through using to the cardiac drift test, it is important to note that, simply monitoring your cardiovascular responses during ANY endurance type training over a period of time, yields exactly the same results. Meaning to say, you can always monitor how your heart responds to training load and make compassions over time.
Let’s explore a real world result as recorded by current RCA member – Ali – in the section below.
Real Results
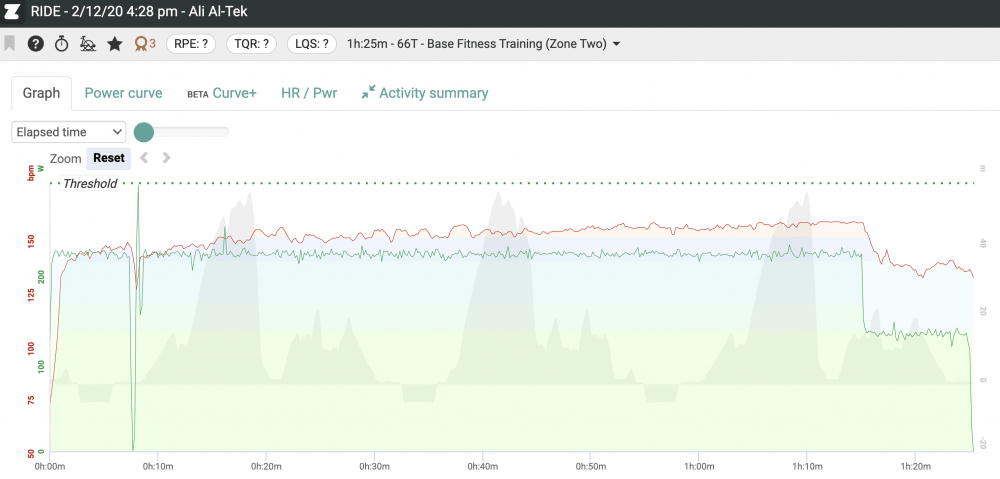
On the 2nd of December 2020, RCA member Ali, performed the cardiac drift test, where for one whole hour Ali was instructed to ride at a steady zone 2 intensity. Now, as part of the protocol, Ali wore his heart rate monitor as depicted on the red line in beats per minute, and had also used a power meter, as seen in the green, measuring power output.
The test recorded Ali’s power in watts, and heart rate in beast per minute over the course of one hour.
Taking a close look at the graph, Ali’s heart rate was set at an approximate average of 150 beats per minute, at a zone 2 power output of 215 watts. Now, because you have been presented with the scientific understanding of cardiac drift, you may notice that Ali has a relatively high average heart rate and he also experiences a cardiac drift over time. Meaning, as a natural response, and as a compensatory measure, Ali’s heart rate increased as his stroke volume dropped off. Which in turn, required Ali’s heart to beat at a faster and harder rate to produce power at a zone 2 intensity.
So the question lies here – maybe Ali has the wrong FTP setting?
Quite frankly, no he does not.
Fast-forwarding a couple of months after a period of base training, Ali performed the cardiac drift test once again. But, this time, his heart rate dropped a whopping 20~ beats per minute, along with less cardiac drift, and at the same power output as the baseline test. Meaning, Ali’s stroke volume would likely to have increased, thereby allowing his heart to eject larger volumes of blood to his working muscles, whilst reducing his heart rate. In other words, Ali did not have to exert as much energy to produce the results that have been recorded!
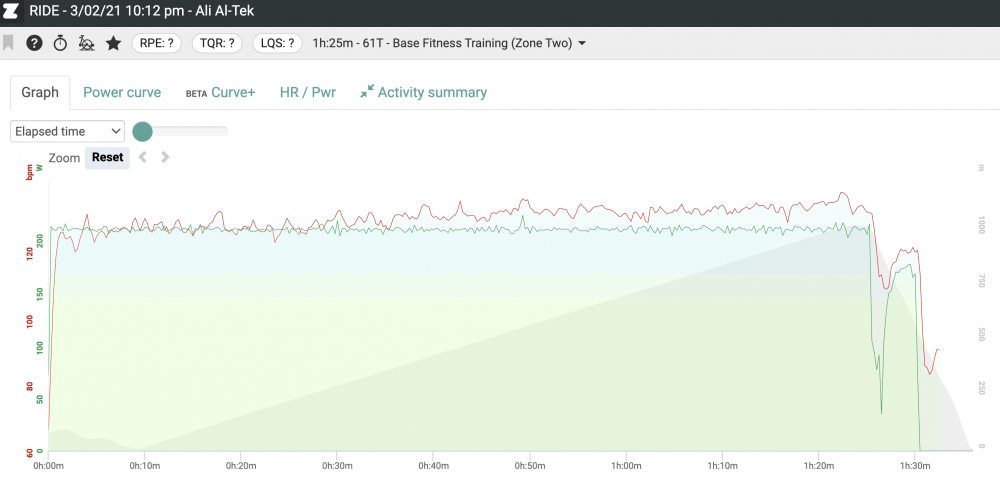
Well, now you can see with your very own eyes, how incorporating some sort of base training can improve cycling economy by a thousand fold. With that said, it all comes down to specificity when you are performing zone 2, or aerobic training.
Rule of Thumb
Summing it all up, using a heart rate monitor for endurance type training, and specifically the cardiac drift test is an extremely useful tool. In general, heart rate represents the real time physiological responses, and subsequent overall training stress on the cardiovascular system, and acute training load [6]. As such, monitoring heart rate is an excellent tool to measure long term training adaptations through the incorporation of the cardiac drift test, when used in conjunction with power data [6]. Now, once you have trained your base fitness, read this article on threshold training and learn how to increase your FTP, once you have achieved your endurance training block.
References
[1] G. Morici, C. I. Gruttad’Auria, P. Baiamonte, E. Mazzuca, A. Castrogiovanni, and M. R. Bonsignore, “Endurance training: is it bad for you?,” Breathe (Sheff), vol. 12, no. 2, pp. 140–147, Jun. 2016, doi: 10.1183/20734735.007016.
[2] L. Passfield, J. Hopker, S. Jobson, D. Friel and M. Zabala, “Knowledge is power: Issues of measuring training and performance in cycling”, Journal of Sports Sciences, vol. 35, no. 14, pp. 1426-1434, 2016. Available: 10.1080/02640414.2016.1215504.
[3] Z. S. Bruss and A. Raja, “Physiology, Stroke Volume,” in StatPearls, Treasure Island (FL): StatPearls Publishing, 2021. Accessed: Dec. 07, 2021. [Online]. Available: http://www.ncbi.nlm.nih.gov/books/NBK547686/
[4] M. Colakoglu, O. Ozkaya, and G. A. Balci, “Moderate Intensity Intermittent Exercise Modality May Prevent Cardiovascular Drift,” Sports, vol. 6, no. 3, Art. no. 3, Sep. 2018, doi: 10.3390/sports6030098.
[5] C. A. Vella and R. A. Robergs, “A review of the stroke volume response to upright exercise in healthy subjects,” British Journal of Sports Medicine, vol. 39, no. 4, pp. 190–195, Apr. 2005, doi: 10.1136/bjsm.2004.013037.
[6] A. E. Saw, L. C. Main, and P. B. Gastin, “Monitoring the athlete training response: subjective self-reported measures trump commonly used objective measures: a systematic review,” Br J Sports Med, vol. 50, no. 5, pp. 281–291, Mar. 2016, doi: 10.1136/bjsports-2015-094758.
While in the 2nd example I see a much lower HR at same power, I do not see much lower drift. One would expect to stay the HR stable for at least 30-45 min before it starts to rise. I assume in both cases the HR drift is not caused by fatigue but more by slowly overheating as the HR rises linearly from the start. In my case when I started after several month of training pause, my HR drifted within the first 20min from low zone 2 out of zone 2 with stable power, but after around 3 month of 6hrs training per week I could ride for 90 min without a single beat of HR drifting up provided I had sufficient cooling. So with HR one has to factor in external factors like heat, hydration, caffeine, stress to properly judge wether the metabolic state is still zone 2.